Category: 2012
Geographies of container shipping: the awesome interactive Shipmap
Given that over 90% of the world’s goods have travelled by sea, anyone interested in ‘follow the thing’ research needs to have a detailed sense of the geographies of container shipping. This animated, interactive shipmap shows global commercial shipping movements (including but not limited to container shipping) in 2012. It’s awesome. It was shortlisted for the Global Editors Network Data Journalism Awards in 2016. Click the image to get to it. Click play and all is explained. Then experiment.
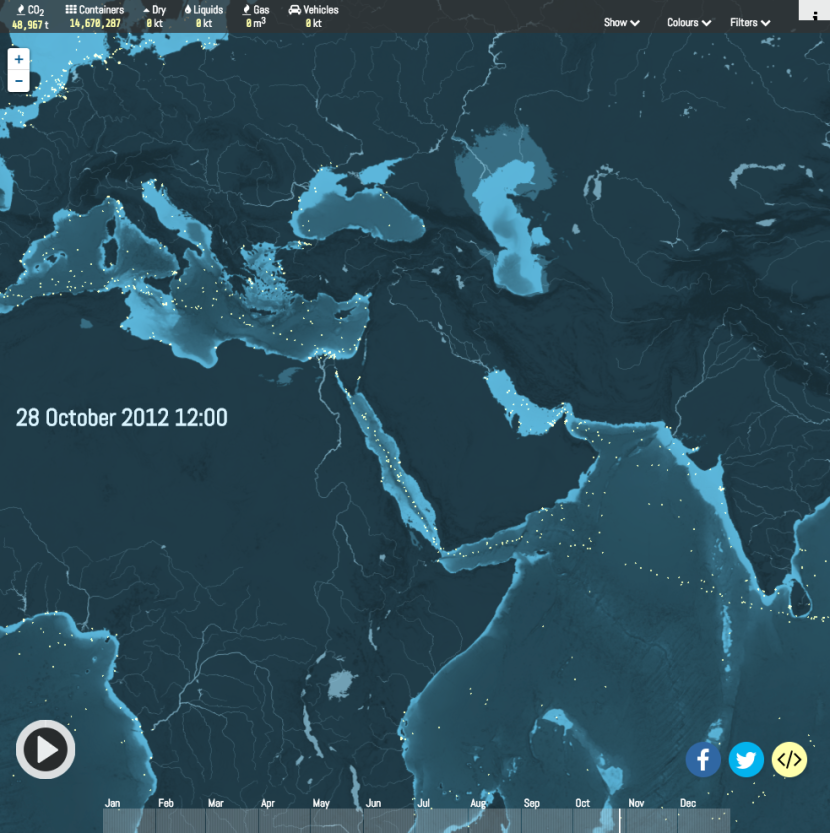 Created by London-based data visualisation studio Kiln and the UCL Energy Institute.
Blueprint for a revolution: incl. LEGO
While we’re on the subject of favourite books, another one is Srdja Popovic’s Blueprint for revolution: how to use rice pudding, LEGO men, and other non-violent techniques to galvanise communities, overthrow dictators or simply change the world. Here’s a summary:
“Through examples of using laughter and music (e.g., Pussy Riot) to disarm the opposition and gather supporters, to staging a protest of Lego Men in Siberia (when flesh-and-blood people would have been shot) … Popovic uses true and sometimes outrageously clever examples of the ways in which non-violent resistance has achieved its means” http://www.blueprintforrevolution.com/
And here’s what he’s talking about. What’s called elsewhere – Political LEGO. Watch this.
